Groundwater Resource Evaluation
Groundwater Modeling
Dr. Hoaglund has spent most of his career researching and applying groundwater models for the management of groundwater resources. That is why you need his expertise to solve your groundwater management problem. He provides the following resources and examples for understanding both the power and limitations of modeling.

On This Page
Dr. Hoaglund understands the economic limitations of modeling projects. He continuously works with the client to define objectives and manage costs. He provides the following guidance to his clients:
Why Model? Understanding the Context of Groundwater Modeling
Groundwater modeling is an invaluable tool for the management of groundwater, for both understanding past occurrences and predicting future occurrences in the region. The insights and predictions obtained from modeling include 1) the effects of multiple pumping wells, 2) the availability of groundwater resources, both in terms of water quantity and quality, 3) the occurrence of natural compounds, and 4) the fate-and-transport of contaminants through time.
Groundwater modeling is a “synthesis (combining) of related but disparate (different and diverse types of) data”. As such, it has a mostly unfair reputation for being expensive, with much of the perceived cost actually being the cost of data acquisition, compilation, and management. Models need to be defined and calibrated with data. To understand any groundwater problem, even without modeling, the data usually need to be compiled anyway.
Groundwater modeling can range from very simple, inexpensive “back of the envelope” calculations to very complex, arguably expensive analyses that may include simulations on the computer. A groundwater model is a mathematical model constructed with a purpose in mind. Thus, the question of its purpose must be answered before beginning the project, to avoid misunderstandings and cost overruns. The more detailed a model, the more it can explain, but the greater the complexity the more information is required to define it and constrain the answer. The mathematics can be simplified, the solution made less expensive, the more that simplifying assumptions can be justified. The industry phrase for this is KISS: Keep It Simple Stupid.
Groundwater modeling is an exercise in deductive reasoning. It starts with an assumption of truth–namely the physics of groundwater flow and the existing field conditions for that flow–and derives its conclusions mathematically. If the assumptions of the truth change, so do the conclusions. Even professionals within the industry will joke about modeling, “What do you want the answer to be?” However, the question, “What do we observe that we need this model to explain?” can lead to many interesting discoveries. “Modeling guides the research.” (-Professor Mary Anderson, University of Wisconsin, Madison).
That is why groundwater modeling must be conducted by a seasoned professional like Dr. Hoaglund who understands and can defend both the initial assumptions and the limitations of its conclusions.
We tend to think deduction is the most powerful form of reasoning. Mathematics entices us to believe its predictions are infallible. After all, we landed the astronauts on the Moon with decimal point precisions using mathematical models of the physics. But the most powerful form of reasoning scientifically is actually induction: the reasoning of general conclusions from particular facts (i.e. data). And facts overrule models.
A single datum not in alignment with a model does not necessarily disprove the model. The model may need to be refined to better match results within statistical error. A groundwater model will never precisely reproduce all the data, but it can continue to make reasonable conclusions matching ordinary data. We can continue to refine the model in a process called calibration. If the model is reasonable and robust in its explanations, it takes a significant finding to unseat it completely. To quote Carl Sagan, “Extraordinary claims require extraordinary evidence.”
Carl Sagan gave the example of Ptolemy’s model of the solar system, which stood the test of time and was used for over 1,000 years until Galileo’s extraordinary observations disproved it, in favor of the Copernican model. If extraordinary evidence is found, we must be willing to reject a model and replace it with a new model, with new starting assumptions of truth.

Geosolid3D
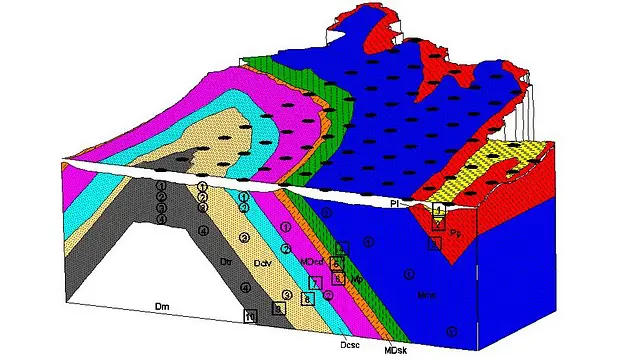
Dr. Hoaglund wrote GeoSolid3D, a solid modeling software used to incorporate geology into groundwater models.
A blog and links to the open source code are available at:
Medium Scale Example (~1:16,000 ): Contaminant Plume Transport From Its Source to a Well
Video of a groundwater plume transport simulation using Supertranp [Superpositioning transport code], a pumping well / solute transport program written by John Hoaglund. The scenario and the scale are real (a plume about 2 miles long not uncommon), but THE LOCATION IS NOT!! For the sake of client confidentiality, the airphoto basemap was “changed to protect the innocent.” A certain speedway was used as the hypothetical release area (3 different releases) with transport for 20 years. The speedway provides a nice scale (oval = 1 mile long). The question posed by the client: Given three known releases, how long will it take for the contamination to reach the well, and could the well be used as a recovery well to prevent further spreading? The plume started arriving 10 years after the first release, and most of the contamination was recovered by the well, though some contamination did spread beyond the well.
The program uses a specified direction and magnitude of the regional groundwater gradient, superposes pumping well solutions, and then uses random walk algorithms (from Rand3D by Donald Koch and Thomas Prickett) to simulate contaminant fate-and-transport.


Regional Scale Example (Large Area / Small Scale Fraction: ~ 1: 3,000,000)
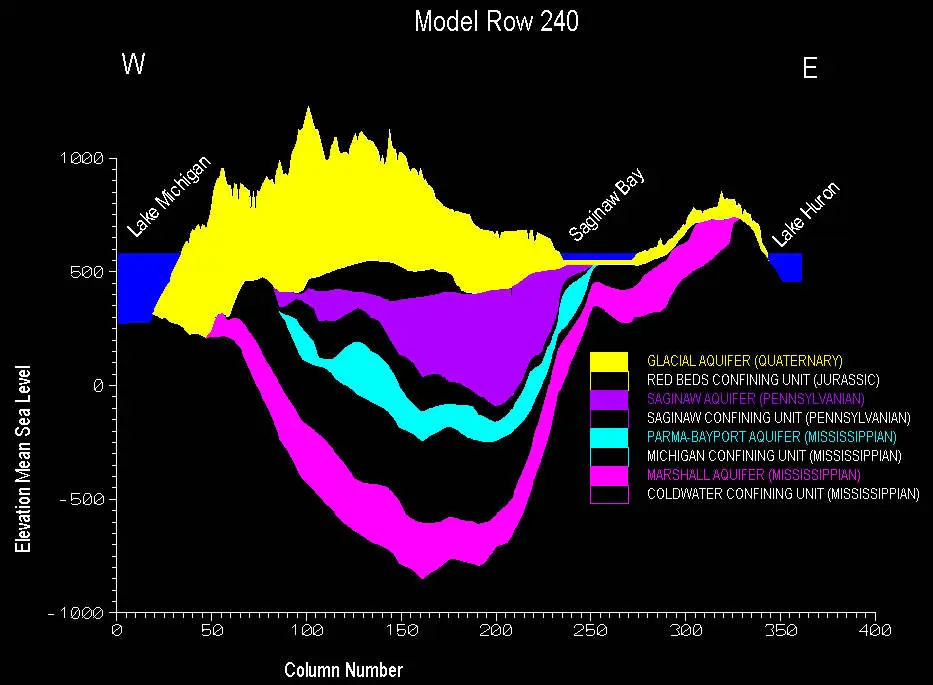
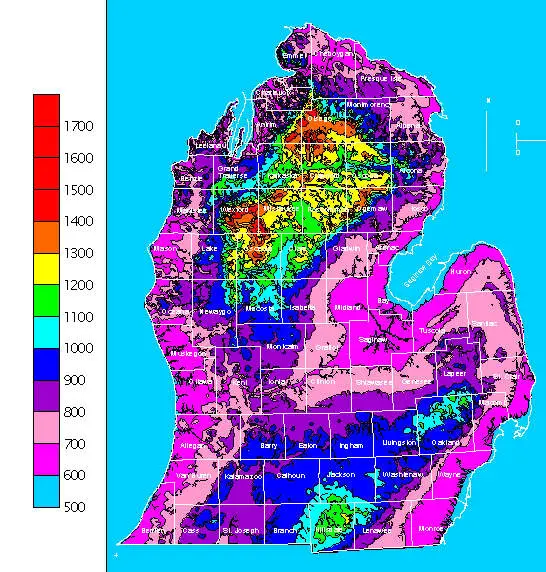
Regional scale models can be used to evaluate water supplies for human use and to evaluate water budgets of the hydrologic cycle affecting multiple watersheds and large lake ecosystems. As part of the US Geological Survey’s RASA (Regional Aquifer Systems Analysis) program, Dr. Hoaglund completed the model for the Michigan Basin, a simulation of 4 major aquifers throughout the Lower Peninsula of Michigan.
The model calculated groundwater levels in each aquifer, including the water table, groundwater discharge to streams (stream baseflow), and groundwater discharge to three Great Lakes. Documentation of the model and the conclusions drawn from it are discussed in USGS Open File Report 00-504 as well as an article in the journal Ground Water:
Hoaglund, J.R., G.C. Huffmann, and N.G.Grannemann, 2002. Michigan Basin regional groundwater flow, discharge to three Great Lakes. Ground Water v 40, n 4. p. 390-405.
Groundwater recharge (water input to the system) was determined in a separate model relating stream baseflow (the portion of stream flow attributed to groundwater) measurements to watershed climate and surface characteristic data. A summary of that study is provided here:
https://geoproven.com/michigan-recharge/
With groundwater discharge going to streams and the Great Lake lateral boundaries of the model, these recharge rates determined the water budget for the model.
The model was calibrated to (i.e. adjusted to match data of) water levels and baseflow stream discharge.
With recharge being determined as a function of the baseflow, the water budget may underestimate the actual water budget by neglecting “underflow,” the groundwater flow that flows beneath and between neighboring basins. A full discussion of this problem is provided in the journal article. Underflow is a component of regional models that is difficult to assess because it cannot be measured directly: it must be determined independently “by proxy” using geochemical tracers and groundwater age data. Direct groundwater flow to the Great Lakes was estimated to be about 7% of the model’s water budget, a value of 1725 CFS, about half of the legally allotted Chicago diversion. For the reasons discussed above, this value is most likely an underestimate of the total direct discharge. Even the underestimated value is a significant component of the overall Great Lakes water budget, critical for the proper management of Great Lake water levels.


Basemap and Geospatial Scaling Information
Google Maps and Bing Maps (formerly Virtual Earth) have standardized maps and airphotos with set zoom levels, using a Mercator projection for online applications that display continuous maps and/or airphotos. Increasingly, these maps and airphotos are being used as base maps for communicating geographic information to clients across many different professions. The following table summarizes the scale and resolution of these maps. Scale ratios always depend on the size of the display or printed map. A comparison to the scale measured on a 14″ computer screen with 112 dpi is presented.
| Google Map | Bing (Virtual Earth) | Measured 1-inch bar*** | Measured Scale*** | Calculated Scale* | Calculated Map Resolution** | Calculated and Listed* | Map resolution** |
|---|---|---|---|---|---|---|---|
| Zoom | Zoom | 14″ screen, 112 dpi | 14″ screen, 112 dpi | 14″ screen, 112 dpi | 39.8 lat | 0 lat, 96 dpi | 0 lat |
| Level | Level | 39.8 lat | 39.8 lat | 39.8 lat | meters / pixel | Equatorial Scales | meters / pixel |
| 22 | 21 | 21.33 ft | 256 | 253 | 0.06 | 282 | 0.07 |
| 21 | 20 | 40 ft | 480 | 506 | 0.11 | 564 | 0.15 |
| 20 | 19 | 84.21 ft | 1,011 | 1,012 | 0.23 | 1,128 | 0.3 |
| 19 | 18 | 168 ft | 2,021 | 2,023 | 0.46 | 2,257 | 0.6 |
| 18 | 17 | 337 ft | 4,042 | 4,046 | 0.92 | 4,514 | 1.19 |
| 17 | 16 | 667 ft | 8,000 | 8,092 | 1.81 | 9,028 | 2.39 |
| 16 | 15 | 1,333 ft | 16,000 | 16,184 | 3.63 | 18,056 | 4.78 |
| 15 | 14 | 2,667 ft | 32,000 | 32,368 | 7.26 | 36,112 | 9.55 |
| 14 | 13 | 1 mi | 63,360 | 64,736 | 14.37 | 72,224 | 19.11 |
| 13 | 12 | 2 mi | 126,720 | 129,473 | 28.74 | 144,448 | 38.22 |
| 12 | 11 | 4 mi | 253,440 | 258,946 | 57.48 | 288,895 | 76.44 |
| 11 | 10 | 8 mi | 506,880 | 517,891 | 114.95 | 577,791 | 152.87 |
| 10 | 9 | 16 mi | 1,013,760 | 1,035,783 | 229.91 | 1,155,581 | 305.75 |
| 9 | 8 | 32 mi | 2,027,520 | 2,071,566 | 459.81 | 2,311,162 | 611.5 |
| 8 | 7 | 67 mi | 4,224,000 | 4,143,132 | 957.94 | 4,622,325 | 1,222.99 |
| 7 | 6 | 133 mi | 8,448,000 | 8,286,264 | 1,915.89 | 9,244,649 | 2,445.99 |
| 6 | 5 | 267 mi | 16,896,000 | 16,572,527 | 3,831.77 | 18,489,298 | 4,891.97 |
| 5 | 4 | 533 mi | 33,792,000 | 33,145,055 | 7,663.54 | 36,978,597 | 9,783.94 |
| 4 | 3 | 1067 mi | 67,584,000 | 66,290,109 | 15,327.09 | 73,957,194 | 19,567.88 |
| 3 | 2 | na | na | na | na | 147,914,388 | 39,135.76 |
| 2 | 1 | na | na | na | na | 295,828,775 | 78,271.52 |
| 1 | 0 | na | na | na | na | 591,657,551 | 156,543.04 |
Footnotes
* Standard scales assume 0 latitude and 96 dpi; note zoom level integers differ by 1
| Google Map | Map scale = 1 : (ScreenRes pixels/inch * 39.37 inches/meter * 156543.04 meters/pixel * cos(latitude) / (2 ^ (zoomlevel-1))) |
| Bing (Virtual Earth) | Map scale = 1 : (ScreenRes pixels/inch * 39.37 inches/meter * 156543.04 meters/pixel * cos(latitude) / (2 ^ zoom level)) |
| Google Map Scales | http://gis.stackexchange.com/questions/7430/what-ratio-scales-do-google-maps-zoom-levels-correspond-to |
| Bing Map Scales | http://msdn.microsoft.com/en-us/library/aa940990.aspx |
Constant 156543.034 meters is the pixel dimension within a 256-pixel Tile of Earth’s total equatorial circumference (at Bing zoom level 0)
A single pixel (within a 256-pixel tile) at zoom 0 has a horizontal dimension of 156543.034 meters (= 1/256 of Earth’s circumference):
About Tiles: http://msdn.microsoft.com/en-us/library/bb259689.aspx
Mercator projection WGS-84 equatorial circumference is 40075.016686 km calculated as CE = 2*pi*radius where the Earth’s radius is a standard 6,378,137 meters
http://en.wikipedia.org/wiki/Equator#Exact_length_of_the_Equator
| RE (meters) | CE (meters) | Meters / Pixel (Within a 256-pixel Tile) |
|---|---|---|
| 6,378,137 | 40,075,017 | 156,543.034 meters |
** Map pixel resolution of 256-pixel
Tile by formula: Resolution = 156543.04 meters/pixel * cos(latitude) / (2 ^ zoom level)
Tile resolution is NOT a function of screen resolution; Resolution is NOT the screen pixel resolution displaying the tile.
http://msdn.microsoft.com/en-us/library/aa940990.aspx
*** Bar scale physically measured on a 14″ computer screen and normalized to 1 inch, with screen resolutions:
| dots | inches | dpi | |
|---|---|---|---|
| Horizontal: | 1366 | 12.25 | 112 |
| Vertical: | 768 | 6.875 | 112 |
Pixel Ratio: 1.78
Inches Ratio: 1.78
Standard 16:9
Screen Ratio: 1.78
Contact Us for Environmental Advising Services
"*" indicates required fields
